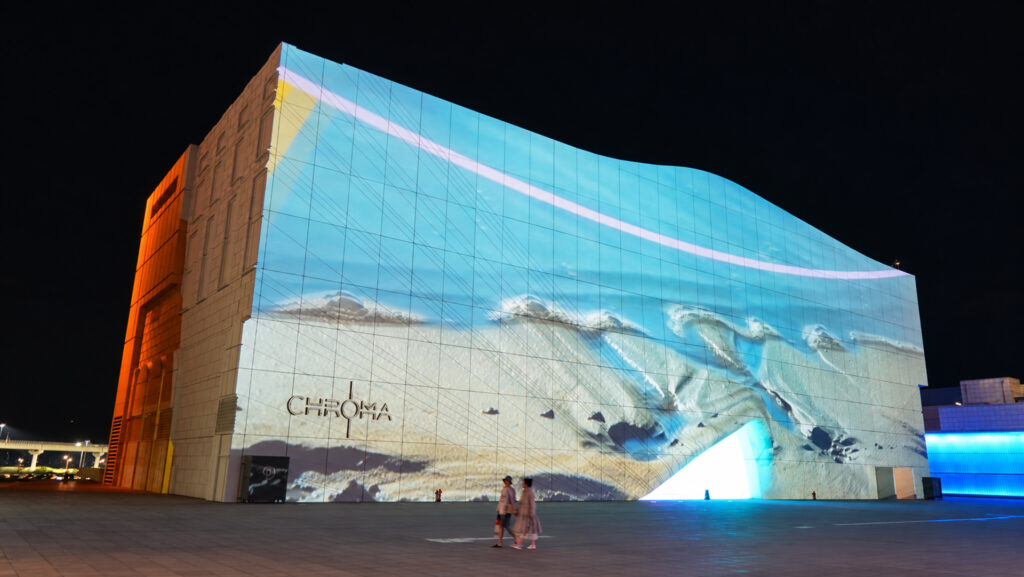
〈당신을 셀 때마다 바다가 왔다〉는 제65회 인천통계연보와 KOSIS 국가통계포털, 국립해양조사원의 해양 데이터를 AI와의 대화로 가공해 쓴 인공지능 시네로망(AI Ciné-roman)이다. 시네로망은 누보로망 계열에서 나온 영화와 소설 사이의 형식이며, 이 작품에서는 데이터로 쓰는 소설 영상을 뜻한다. 화면에 놓이는 모든 수치와 추이는 공식 통계의 사실이고, 그 수치 위에서 한 사람의 하루가 쓰인다.
통계는 수백만의 합이지만, 그 합을 이루는 한 칸은 언제나 한 사람의 하루다. 작품은 도시 스케일의 집계 층위와 한 인물의 하루라는 단위 층위를 오가는 'N분의 1의 서사'로 구성된다. 주인공은 통계의 최빈값으로 만든 인천 서구의 50대 1인 가구 남성이다. 인구 피라미드에서 가장 긴 층인 50대 초반 262,005명, 가구원수별로 가장 많은 1인 가구 411,532가구, 종사자가 가장 많은 업종인 제조업의 242,091명, 그리고 인구가 가장 많은 서구가 그의 조건이다. 그는 허구의 인물이지만 그를 이루는 조건은 모두 사실이며, 어디에나 있으므로 어디에도 없는 사람이다.
카메라는 통계가 아는 것만 안다. 그래서 그에게는 이름도, 사연도, 내레이션도 없고, 알아볼 수 있는 얼굴은 데이터 그래픽으로 덮인다. 이 규칙은 19세기 아돌프 케틀레의 '평균인' 개념이 인간을 하나의 표준으로 환원하고 이후 우생학으로 전용된 역사에 대한 응답이다. 최빈값으로 한 사람을 세우되 그에게 이름과 목소리를 주지 않는 것은 양식의 선택이 아니다. 숫자가 한 사람에 대해 알 수 있는 것과 알 수 없는 것의 경계를 지키려는 윤리적 태도다.
작품은 인천통계연보의 목차를 작품의 목차로 삼는다. 프롤로그 '연보를 펼치다', 1장 '인구', 2장 '일', 3장 '물때', 4장 '사람들', 5장 '추계', 에필로그 '다시 격자로'의 일곱 장, 54개 장면으로 이루어진다. 장면마다 연보의 표가 하나씩 배정되어, 토지 및 기후에서 공공행정 및 사법에 이르는 연보 16장의 목차가 모두 작품 안에 들어간다. 통계서를 읽는 행위가 도시의 소설을 읽는 행위가 되는 구조다.
작품은 1883년, 개항의 연도에서 시작한다. 연도가 오르는 동안 통계표의 격자가 인구에 비례해 자라고, 바다 쪽 가장자리로 매립의 칸이 늘어난다. 격자의 한 칸이 켜지고, 그 칸은 새벽 서구의 한 창이 된다. 그는 창 앞에서 셔츠를 입고 출근한다. 출근길의 건물은 사업체 수의 막대가 되고, 사업장 정문의 숫자판은 지나는 사람을 하나씩 센다. 같은 새벽 어시장에서는 물때에 맞춰 좌판이 열리고, 저녁의 횡단보도에서는 아이와 그와 노인이 연령 구성의 비율로 나뉜 흰 줄을 건넌다. 장래인구추계의 곡선을 따라 시간이 흐르고, 2050년에 그의 창이 꺼진다. 다음 장면에서 한 아이의 창이 켜지며, 그 창의 자리는 프롤로그의 커서가 멈춘 칸이다. 에필로그에서 그는 다시 표의 한 칸으로 돌아간다.
도시가 그를 셀 때마다, 그보다 더 오래된 시간표를 가진 바다가 들어온다. 인천의 바다는 조차가 8~10m에 이르고, 하루 두 번 도시의 가장자리를 지웠다 다시 그린다. 통계가 해마다 갱신되는 동안 바다는 조석의 주기로 드나든다. 에필로그에서 개항 이후 격자로 넓어진 도시는 안에서는 장래인구추계로 비워지고, 밖에서는 2100년까지 47~82cm로 전망되는 해수면 상승으로 지워진다.
연출은 방향과 남는 것에서 출발한다. 같은 수치도 재생 방향에 따라 상실로도, 회복으로도 읽힌다. 세계가 방향을 바꾸면 통계도 거꾸로 흐르지만, 사람은 언제나 정방향으로 움직인다. 그리고 어느 방향에서도 세어지지 않는 것이 남는다. 빈 좌판, 꺼진 창, 갯벌의 물길, 그리고 바다다. 세계가 거꾸로 돌아도 조석은 원래 방향으로 흐른다. 작품은 뒤집을 수 있는 통계와 뒤집을 수 없는 바다 사이에서, 세어지지 않고 남는 것의 자리를 묻는다.
제작은 데이터를 근거로 한 대화로 이루어졌다. 방대한 연보 데이터를 영상으로 옮기기 위해 시놉시스는 4차, 시나리오는 6차, 프롬프트는 15차까지 대화로 고쳐 썼다. 영상 생성 플랫폼은 MCP로 대화 창에 연결해, 대화 안에서 클립을 만들고 원표와 대조했다. 한 장면은 세 층으로 이루어진다. 글자와 숫자가 없는 생성형 AI 실사 플레이트, 표의 비율과 형태를 옮겨 코드로 그린 데이터 모션 그래픽, 그리고 매체마다 따로 렌더한 숫자 레이어다. 숫자는 항목명 없이 값과 측정 단위로만 쓰이고, 그래픽의 비례가 항목명을 대신한다. 수출과 수입으로 나뉜 컨테이너의 띠, 하루 505건의 119 신고를 세는 횡단보도의 점처럼 숫자와 그래픽은 같은 것을 센다. 데이터 수집에서 생성과 검증에 이르는 이 방법론 체계가 작품의 방법론인 Site-Specific Data-Driven Visual이다.
작품은 세 개의 판으로 완성되었다. 3840 × 1620의 초광폭 원본판, 5184 × 992의 인천스타트업파크 LED 미디어월판, 6236 × 2272 화면을 프로젝터로 투사하는 파라다이스시티 크로마 외벽판이다. 화면비가 다른 만큼 장면의 배치와 숫자의 자리를 매체마다 다시 계산했고, 현장 테스트의 측정값으로 매체별 보정을 거쳤다. 지나는 길에 작품을 마주치는 관객을 전제로, 어느 순간부터 보더라도 작품의 질문이 성립하도록 편집되었다.
이 도시의 모든 숫자는 누군가의 하루다. 〈당신을 셀 때마다 바다가 왔다〉는 도시의 공식 기록인 통계를 도시의 이야기로 옮기며, 그 이야기가 끝내 세지 못한 것을 화면 위에 남겨 둔다.
Public statistical data, generative AI video (multiple models), code-based data motion graphics, sound
Single-channel video (Site-Specific Data-Driven Visual), color, sound, 3′40″, original version: 3840 × 1620 (4K ultra-wide, 2.37:1)
Description (English, full text)
Every Time We Counted You, the Sea Came In is an AI ciné-roman shaped through dialogue with AI from the 65th Incheon Statistical Yearbook, KOSIS (Korean Statistical Information Service), and ocean data from the Korea Hydrographic and Oceanographic Agency (KHOA). The ciné-roman, a form that emerged from the nouveau roman tradition between cinema and the novel, here becomes a novel written in data and told as video. Every figure and trend on screen is a fact drawn from official statistics, and upon those figures the day of a single person is written.
A statistic is the sum of millions, yet each cell within that sum is always one person's day. The work is structured as a narrative of one in N, moving between the aggregate layer of the city and the unit layer of one man's day. Its protagonist, a man in his fifties living alone in Seo-gu, Incheon, is built from the city's most common values: the longest band of the population pyramid, 262,005 people in their early fifties; the most common household size, 411,532 single-person households; the industry with the most workers, manufacturing, at 242,091; and Seo-gu, the district with the largest population. He is fictional, but every condition that makes him is fact. Present everywhere, he is therefore nowhere.
The camera knows only what the statistics know. He has no name, no backstory, and no narration, and any recognizable face is covered by data graphics. This rule responds to the history of Adolphe Quetelet's "average man," a nineteenth-century concept that reduced people to a single norm and was later appropriated by eugenics. To build a person from modal values while withholding a name and a voice is not a stylistic choice. It is an ethical stance that holds the line between what numbers can and cannot know about a person.
The work takes the yearbook's table of contents as its own. It unfolds in seven chapters and 54 scenes, moving from a prologue that opens the yearbook through population, work, the tides, people, and projections to an epilogue that returns to the grid. Each scene is assigned a single table from the yearbook, so that all 16 chapters of its contents, from Land and Climate to Public Administration and Justice, are contained within the work. Reading a statistical yearbook becomes reading a novel of the city.
The work begins in 1883, the year Incheon Port opened. As the years count upward, the grid of a statistical table grows in proportion to the population, and cells of reclaimed land spread along its seaward edge. One cell lights up and becomes a window in Seo-gu at dawn. He puts on a shirt by the window and leaves for work. Along his commute, buildings become bars counting businesses, and the counter at the factory gate tallies each person who passes. At the same dawn, stalls at the fish market open with the tide, and in the evening a child, the man, and an elderly person cross a crosswalk whose white stripes are divided by the city's age structure. Time moves along the curve of population projections, and in 2050 his window goes dark. In the next scene a child's window lights up, in the very cell where the prologue's cursor came to rest. In the epilogue he returns to a single cell of the table.
Each time the city counts him, the sea, keeping an older timetable, comes in. Incheon's tidal range reaches 8 to 10 meters, and twice a day the sea erases and redraws the city's edge. While the statistics are renewed year by year, the sea comes and goes with the tides. In the epilogue the city, which expanded as a grid after the port opened, is emptied from within by population projections and erased from without by a sea level projected to rise 47 to 82 centimeters by 2100.
The staging of the work rests on direction and on what remains. The same figure can read as loss or as recovery depending on the direction of playback. When the world reverses, the statistics run backward, yet people always move forward. And in either direction, something uncounted remains: an empty stall, a darkened window, a channel in the tidal flat, and the sea. Even when the world runs backward, the tide flows in its own direction. Between statistics that can be reversed and a sea that cannot, the work asks where the uncounted remains.
The work was made through dialogue grounded in data. To translate the yearbook's vast data into moving image, the synopsis was rewritten through four versions, the scenario through six, and the prompts through fifteen. Video generation platforms were connected to the conversation through MCP, so that clips were generated within the dialogue and checked against the original tables. Each scene is composed of three layers: an AI-generated live-action plate free of text and numbers, data motion graphics drawn in code to carry the proportions and forms of the tables, and a number layer rendered separately for each medium. Numbers appear only as values and units of measurement, without labels, and the proportions of the graphics take the place of labels. In the bands of containers divided between exports and imports, or in the dots on a crosswalk counting 505 emergency calls a day, the numbers and the graphics count the same thing. This system, from data collection through generation and verification, is the work's methodology, Site-Specific Data-Driven Visual.
The work was completed in three versions: an ultra-wide original at 3840 × 1620, a version for the Incheon Startup Park LED Media Wall at 5184 × 992, and a version projected at 6236 × 2272 onto the PARADISE CITY Chroma Facade. Because each surface has a different aspect ratio, the composition of every scene and the placement of every number were recalculated for each medium, and each version was calibrated using measurements from on-site tests. Edited for passersby who encounter it along the way, the work is structured so that its question holds from whatever moment viewing begins.
Every number in this city is someone's day. Every Time We Counted You, the Sea Came In carries the city's official record into the city's story, and leaves on the screen what that story could never count.
Planning & Operation : (주)씨투아테크놀러지, 모아 @thisis_moa_ / C2 Artechnolozy, MOA (Mosaic of Art) Venue Support : 인천경제자유구역청, 파라다이스시티 / Incheon Free Economic Zone Authority, PARADISE CITY Production Support : 문화체육관광부, 한국콘텐츠진흥원, 인천광역시, 인천테크노파크 / Ministry of Culture, Sports and Tourism, Korea Creative Content Agency, Incheon Metropolitan City, Incheon Technopark